
The Shopper-Analytics app
The Shopper-Analytics app (apps/orascom-shopper-analytics-app) is the internal
business-intelligence portal that sits over the shopper-portal data: sales, leads, engagement,
demographics, and the sales funnel. It is read-only reporting — there is no data entry here — and it
is used by the analytics/shopper-admin persona, not by customers or agents.
It is one of the four React SPAs in the frontend Nx monorepo, but it is the odd one out in two ways
worth knowing before you touch it:
The app at a glance
Section titled “The app at a glance”- Entry:
src/main.tsxinits Sentry (NX_SENTRY_ANALYTICS_DSN) and rendersI18nextProvider+ProSidebarProvider+ToastContainer— noQueryClientProvider.src/app/app.tsxwrapsUSER_CONTEXT+FILTER_CONTEXTaround the router (app.tsx:72-77). - Router:
basename = process.env['NX_SHOPPER_ANALYTICS_PATH'] ?? '/'(routes.tsx:122). - 12 routes / screens: 3 auth (
/login,/forget-password,/set-password) + 9 dashboards. - API: one
ENDPOINTSmap (src/api/endpoints.ts), 35 keys (5 auth/user + 30 analytics, allGET), prefixed withNX__SHOPPER_ANALYTICS_ENDPOINT_PREFIXover base hostNX__SHOPPER_ANALYTICS_API_ENDPOINT.
The left sidebar (components/sidebar) groups the nine dashboards under five headings — this is the
map to keep in your head:
- Overview
- Performance → Sales Performance · Lead Insights · Funnel Analysis
- Engagement → Customer Behavior · Demographics
- Services
- Destinations → one drill-down per destination (O-West, Makadi Heights, El-Gouna, Jebel Sifah, Hawana Salalah, Lustica Bay)
The dashboards
Section titled “The dashboards”Every dashboard is a composition of the shared chart primitives in src/components
(bar-chart, line-chart, pie-chart-card, summary-card) fed by one of the data-service classes
in src/api/*.ts (Analytics, Performance, Engagement, Destination, Services). Each service
is a thin Network.fetch + constructURL wrapper over the current FILTER_CONTEXT params
(period + destination + unit-type).
Overview — /
Section titled “Overview — /”The landing dashboard: the global period / destination / unit-type filters, KPI summary cards, and
destination & unit-type performance. pages/overview/overview.tsx.
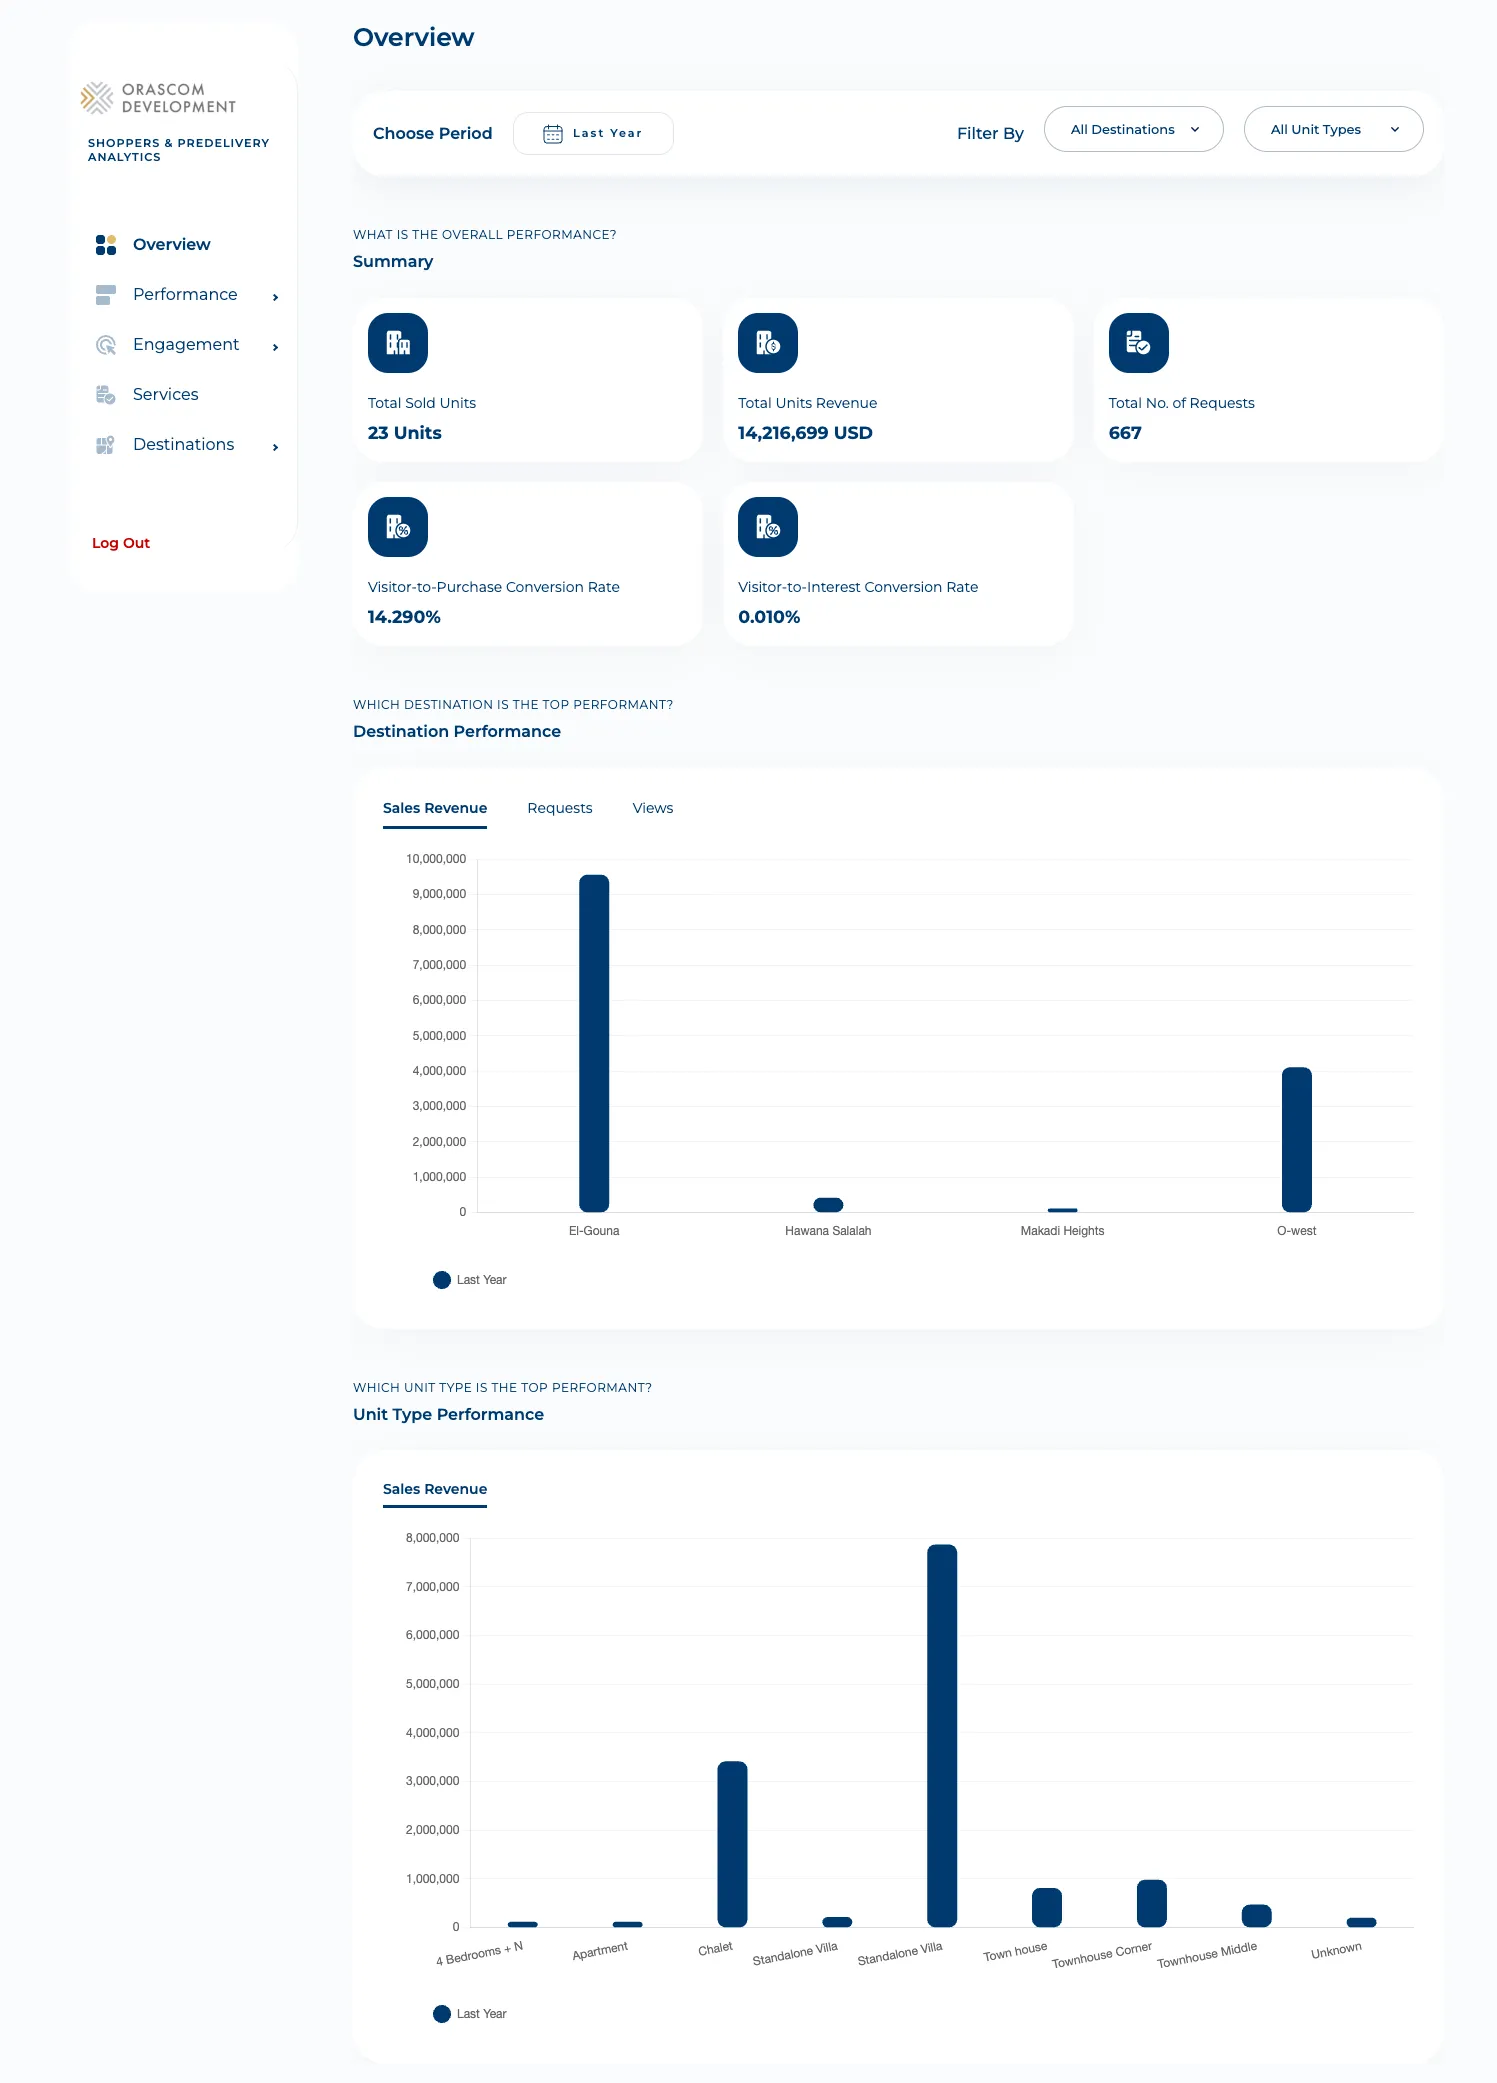
Calls: getAnalyticsOverviewSummary (/analytics/overview-summary),
getAnalyticsOverviewUserPurchaseSummary (.../users-purchase),
getAnalyticsOverviewUserInterestSummary (.../users-interest-conversion),
getAnalyticsUnitPerformance (/analytics/unit-types-performance),
getAnalyticsDestinationPerformance (/analytics/destinations-performance),
getAnalyticsDestinationViews (/analytics/destinations-ggl-views),
getAnalyticsLoginsOverTime (/analytics/logins/sessions-breakdown).
Sales Performance — /sales-performance
Section titled “Sales Performance — /sales-performance”Payment breakdowns, the sales-performance breakdown, unit sales revenue, and a referrals overview.
pages/sales-performance/sales-performance.tsx.
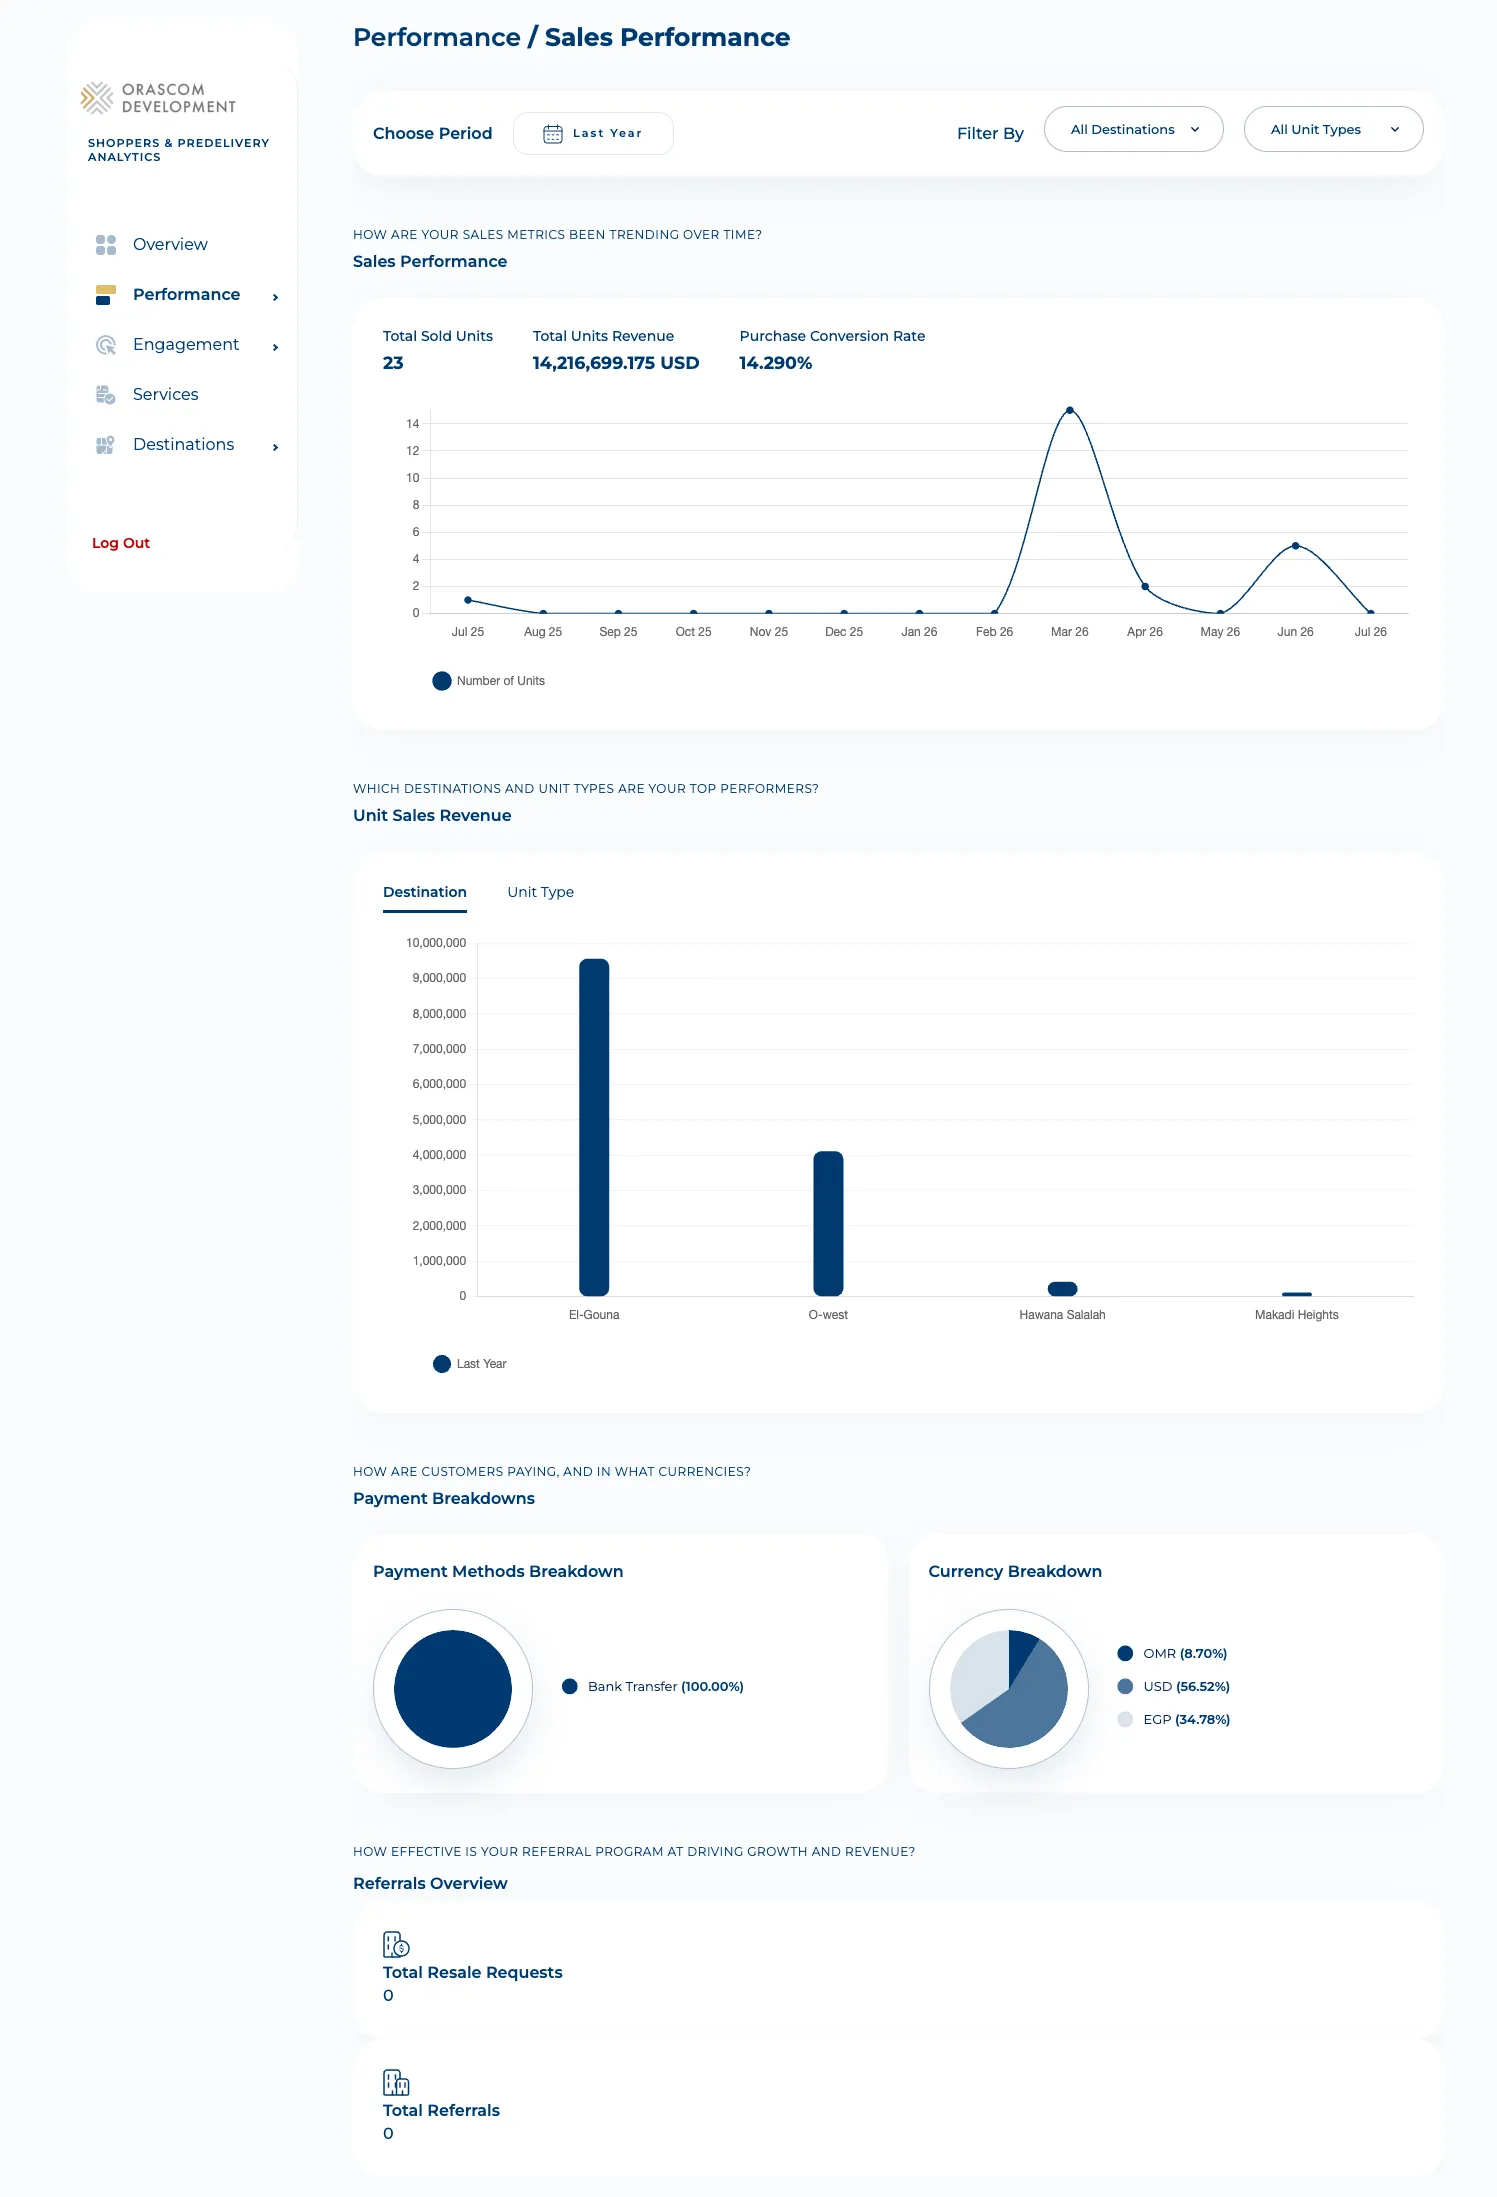
Calls (the Performance service): getAnalyticsSalesPerformance
(/analytics/sales/performance-breakdown), getAnalyticsUnitSalesRevenue
(/analytics/sales/top-performers), getSalesPerformancePaymentBreakdown
(/analytics/sales/payment-breakdown), getSalesPerformanceCurrencyBreakdown
(/analytics/sales/currency-breakdown), getAnalyticsSalesRevenuePerUnitType
(/analytics/sales/sales-revenues-per-unit-types).
Lead Insights — /lead-insights
Section titled “Lead Insights — /lead-insights”Leads performance, leads per destination, sales-vs-leads, and direct-vs-indirect.
pages/lead-insights/lead-insights.tsx.
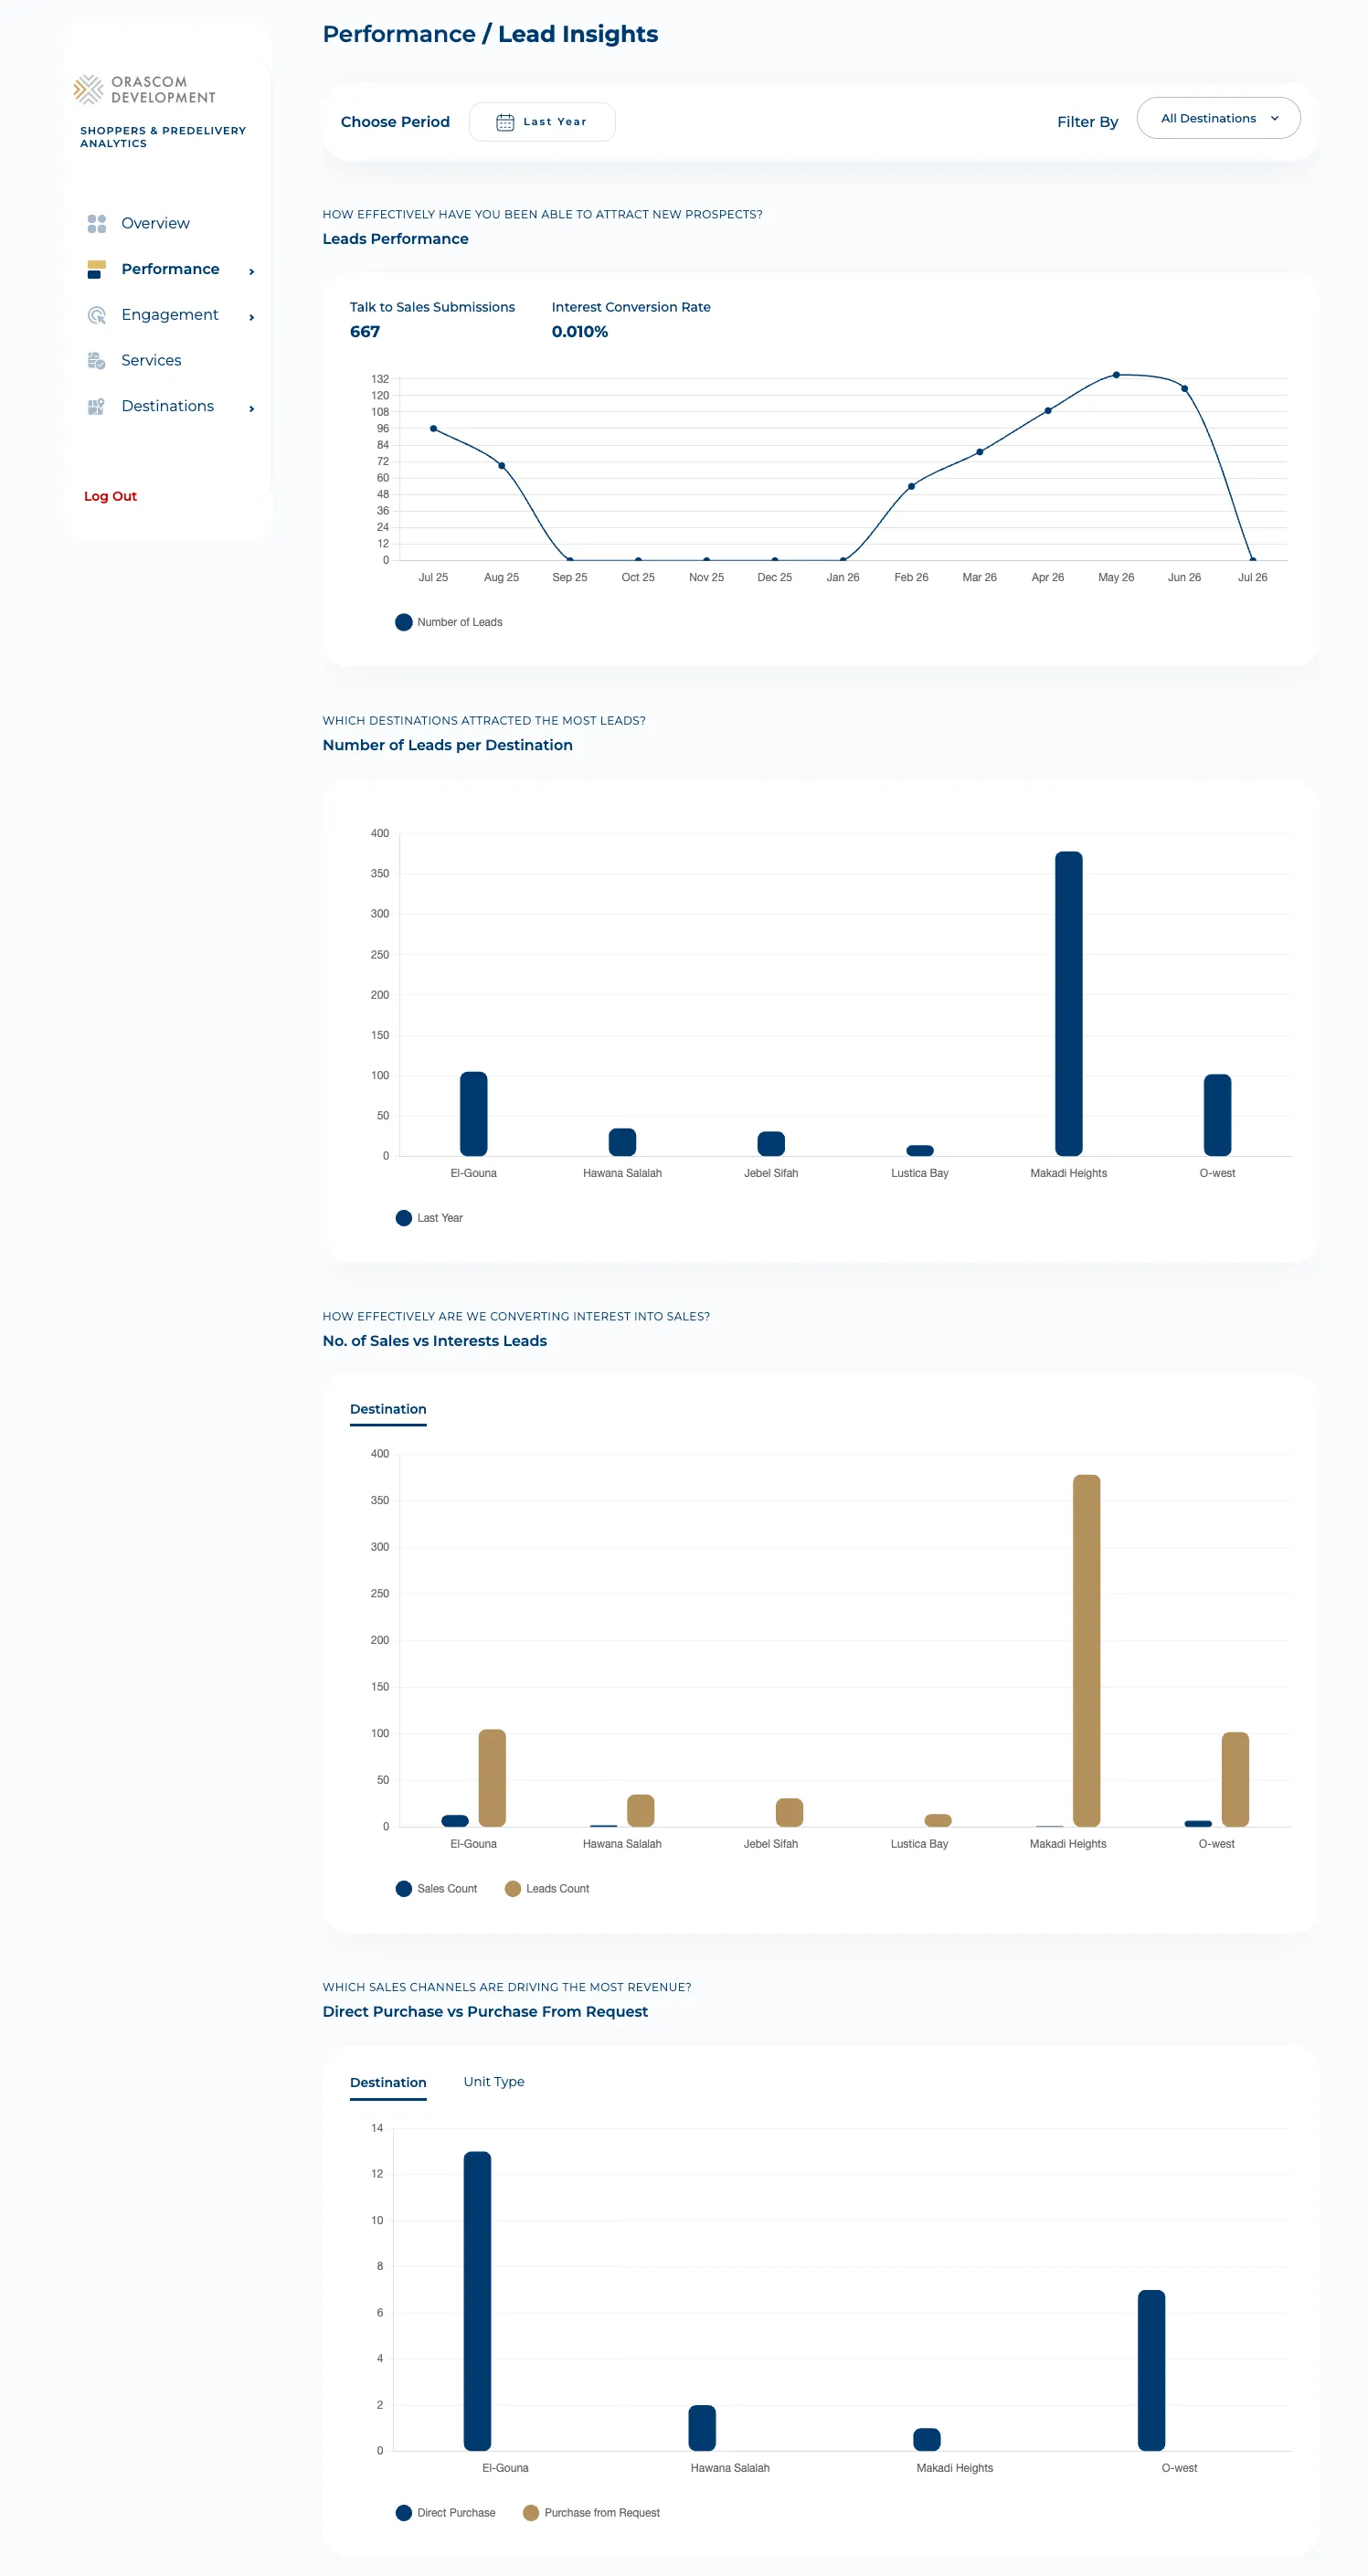
Calls: getAnalyticsLeadsPerformance (/analytics/leads/performance),
getAnalyticsLeadsPerDestination (/analytics/leads/count-per-destinations),
getSalesCountPerDestination (/analytics/leads/sales-count-per-destinations),
getAnalyticsDirectVsIndirectSales (/analytics/sales/direct-vs-indirect-purchase).
Funnel Analysis — /funnel-analysis
Section titled “Funnel Analysis — /funnel-analysis”The sales funnel as online-vs-offline lifecycle stages. pages/funnel-analysis/funnel-analysis.tsx.
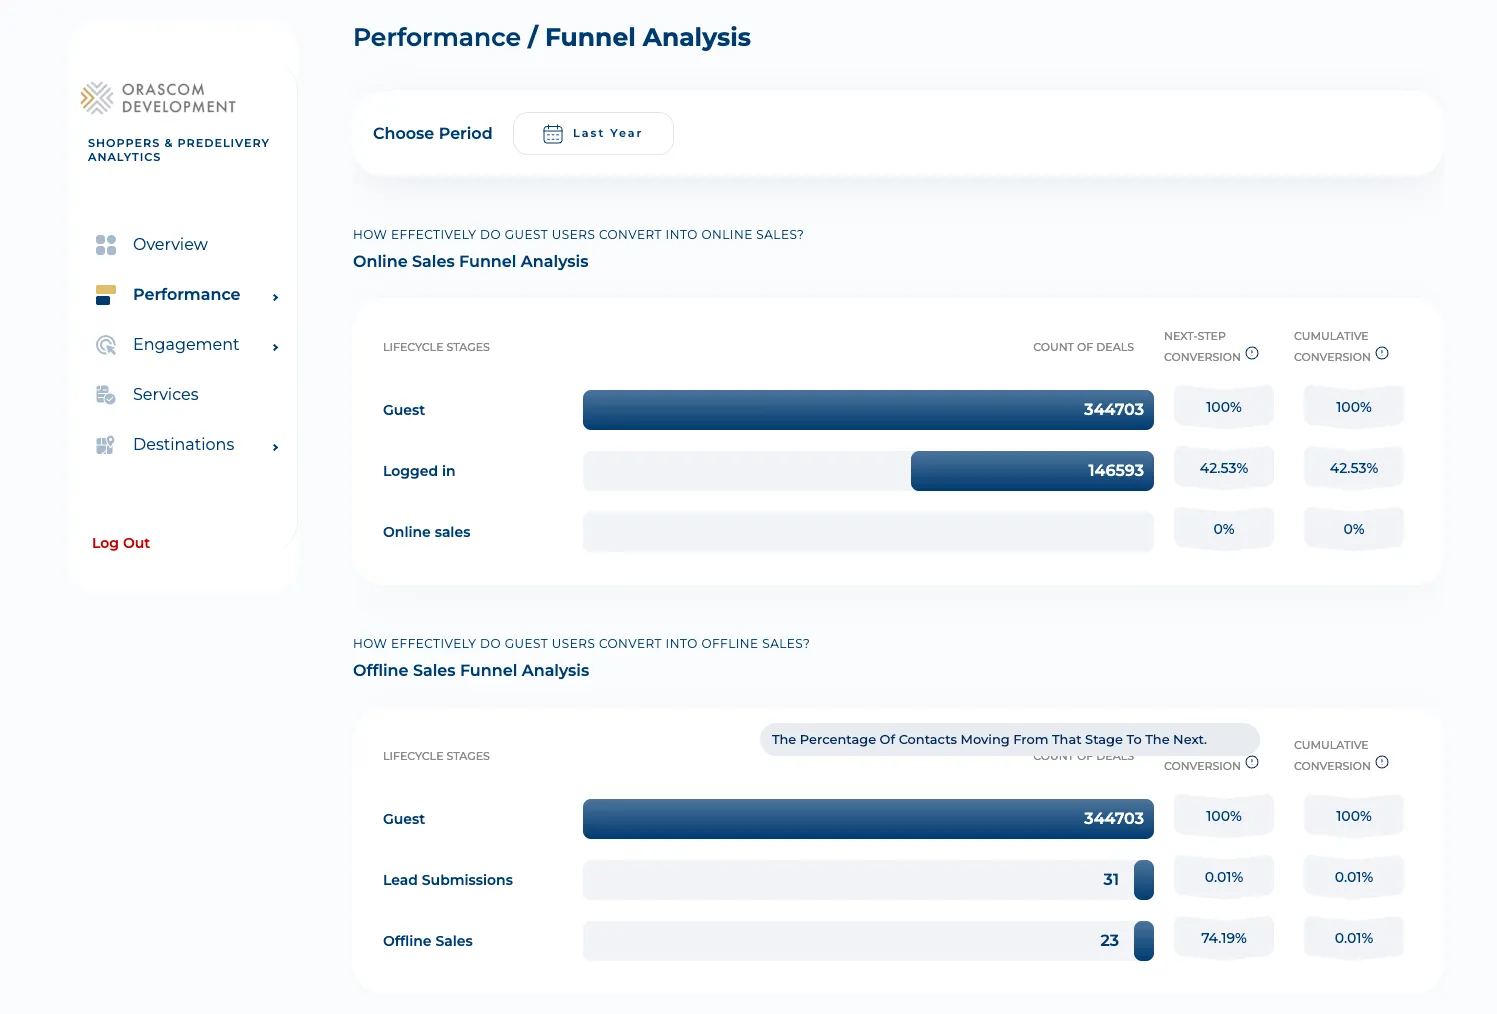
Calls: getAnalyticsSalesFunnel (/analytics/funnel-analysis/online-offline-sales).
Customer Behavior — /customer-behavior
Section titled “Customer Behavior — /customer-behavior”Most-viewed and most-searched units, and searches that returned no availability (with a CSV export).
pages/customer-behaviour/customer-behavior.tsx.
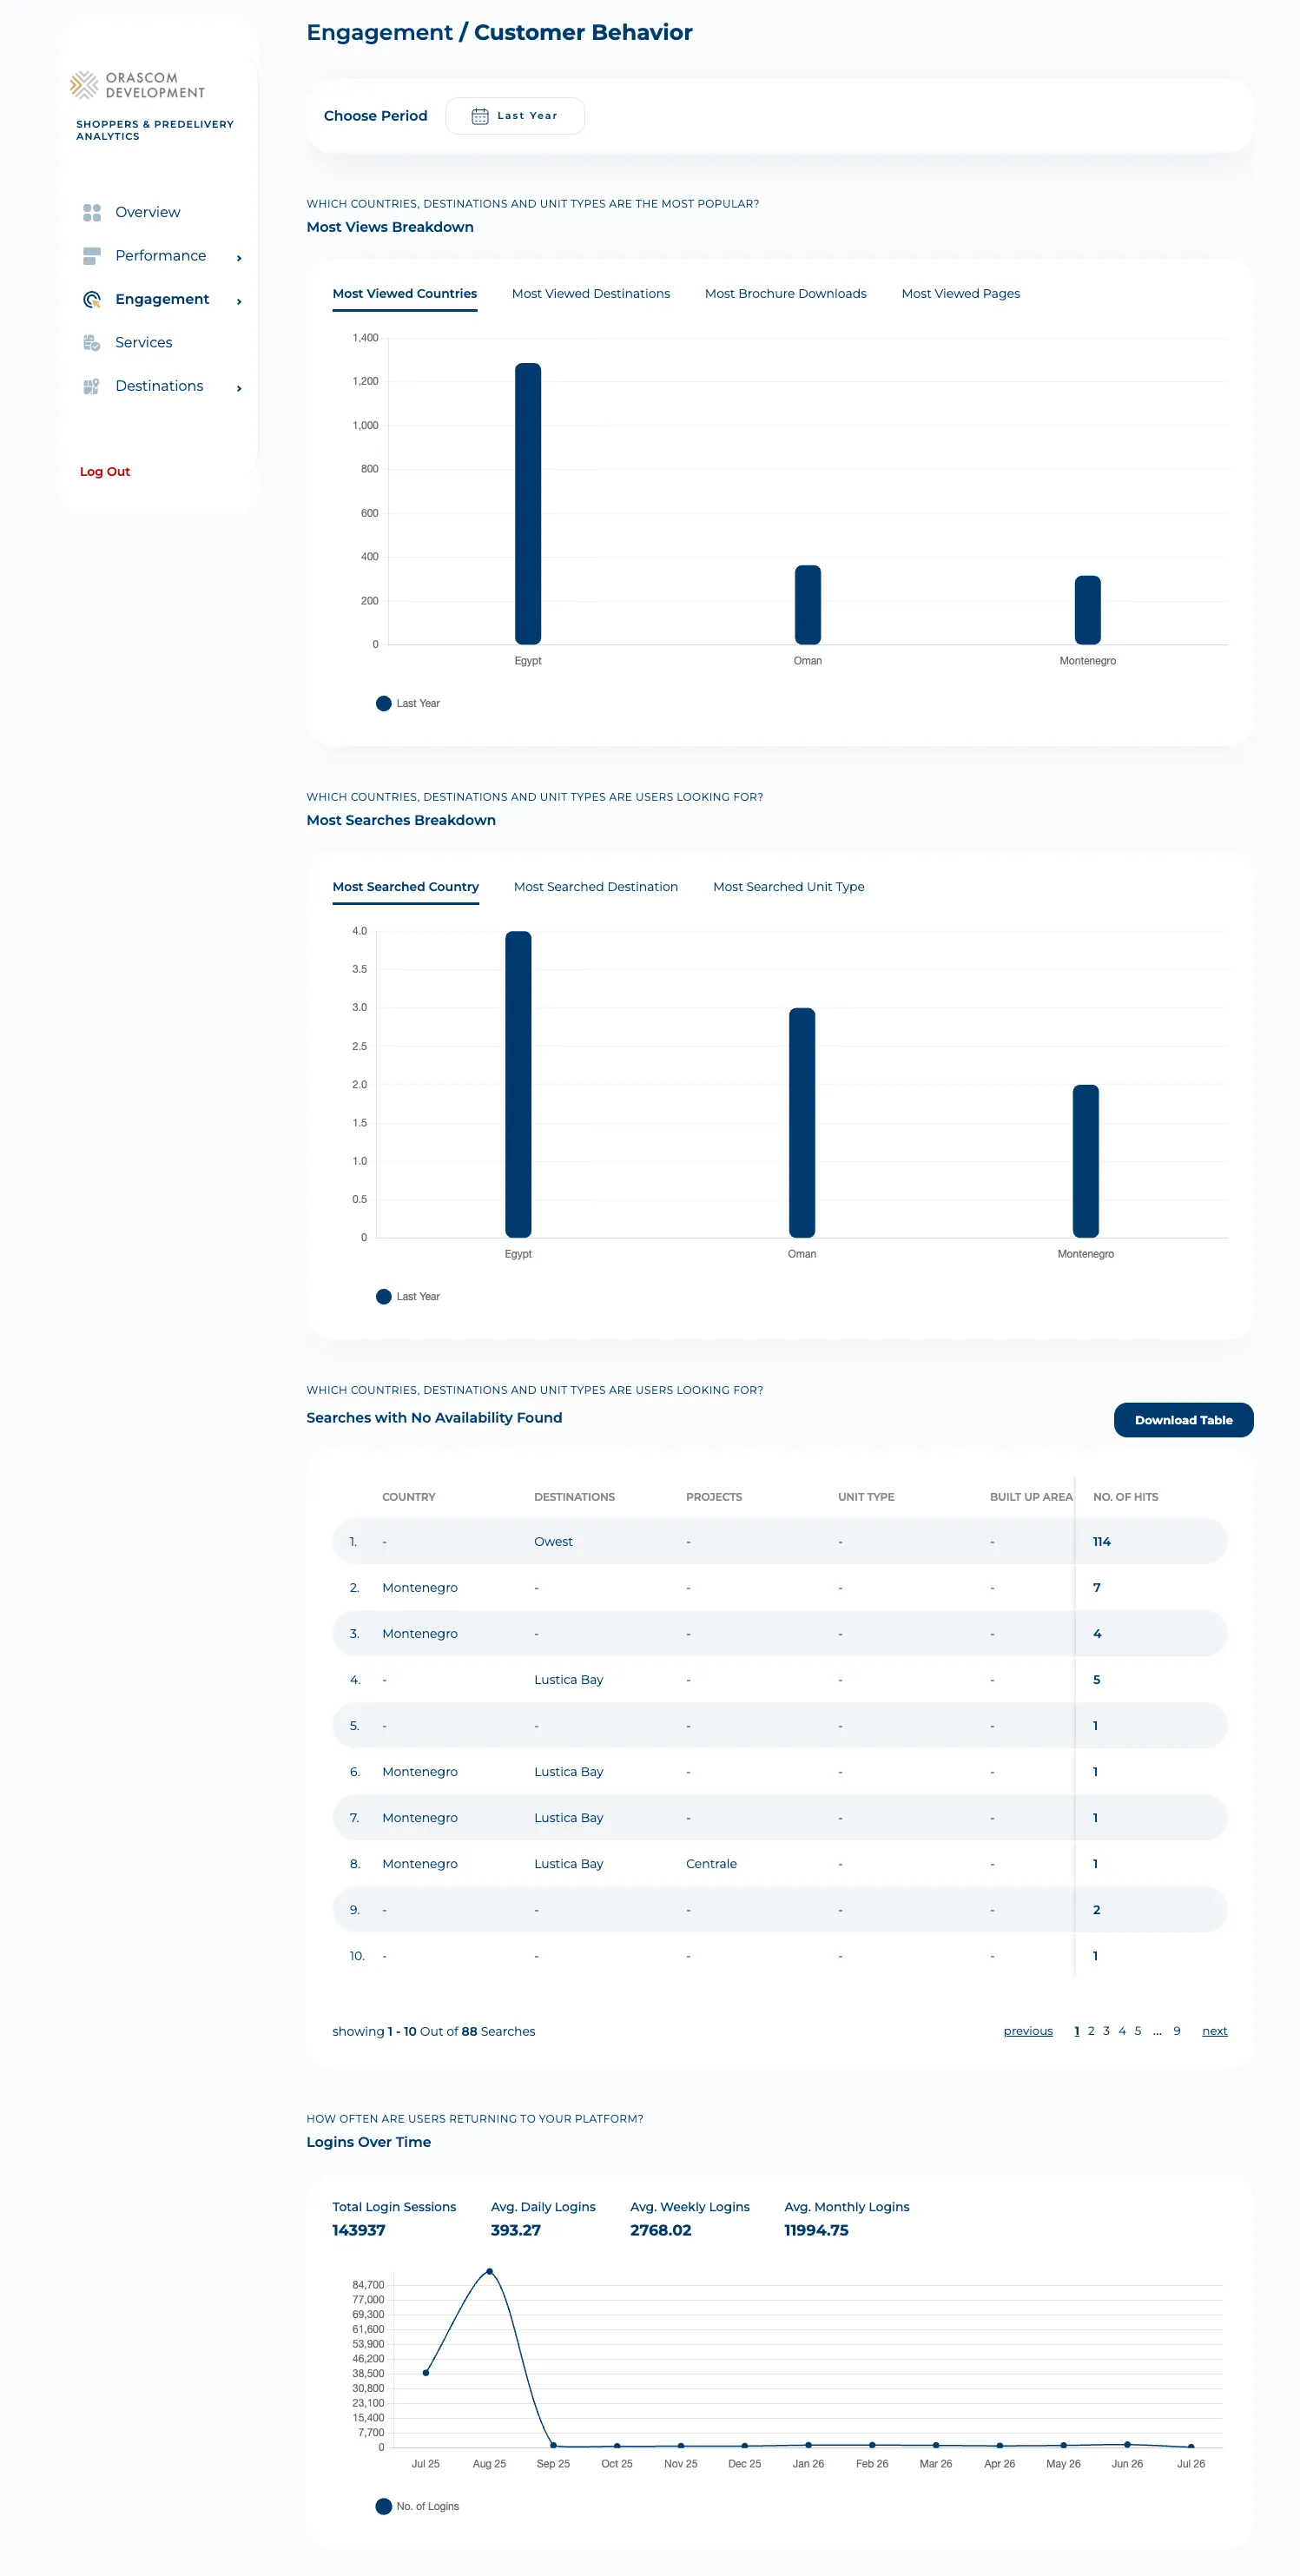
Calls: getAnalyticsMostViewsBreakdown (/analytics/customer-behavior/ggl-most-views-breakdown),
getAnalyticsMostSearchesBreakdown (/analytics/customer-behavior/most-searches-filters),
getSearchesWithNoAvailability (/analytics/customer-behavior/search-with-no-results) plus its
export twin exportSearchesWithNoAvailability (.../search-with-no-results/export).
Demographics — /demographics
Section titled “Demographics — /demographics”Page-views, sales, and leads broken down per country. pages/demographics/demographics.tsx.
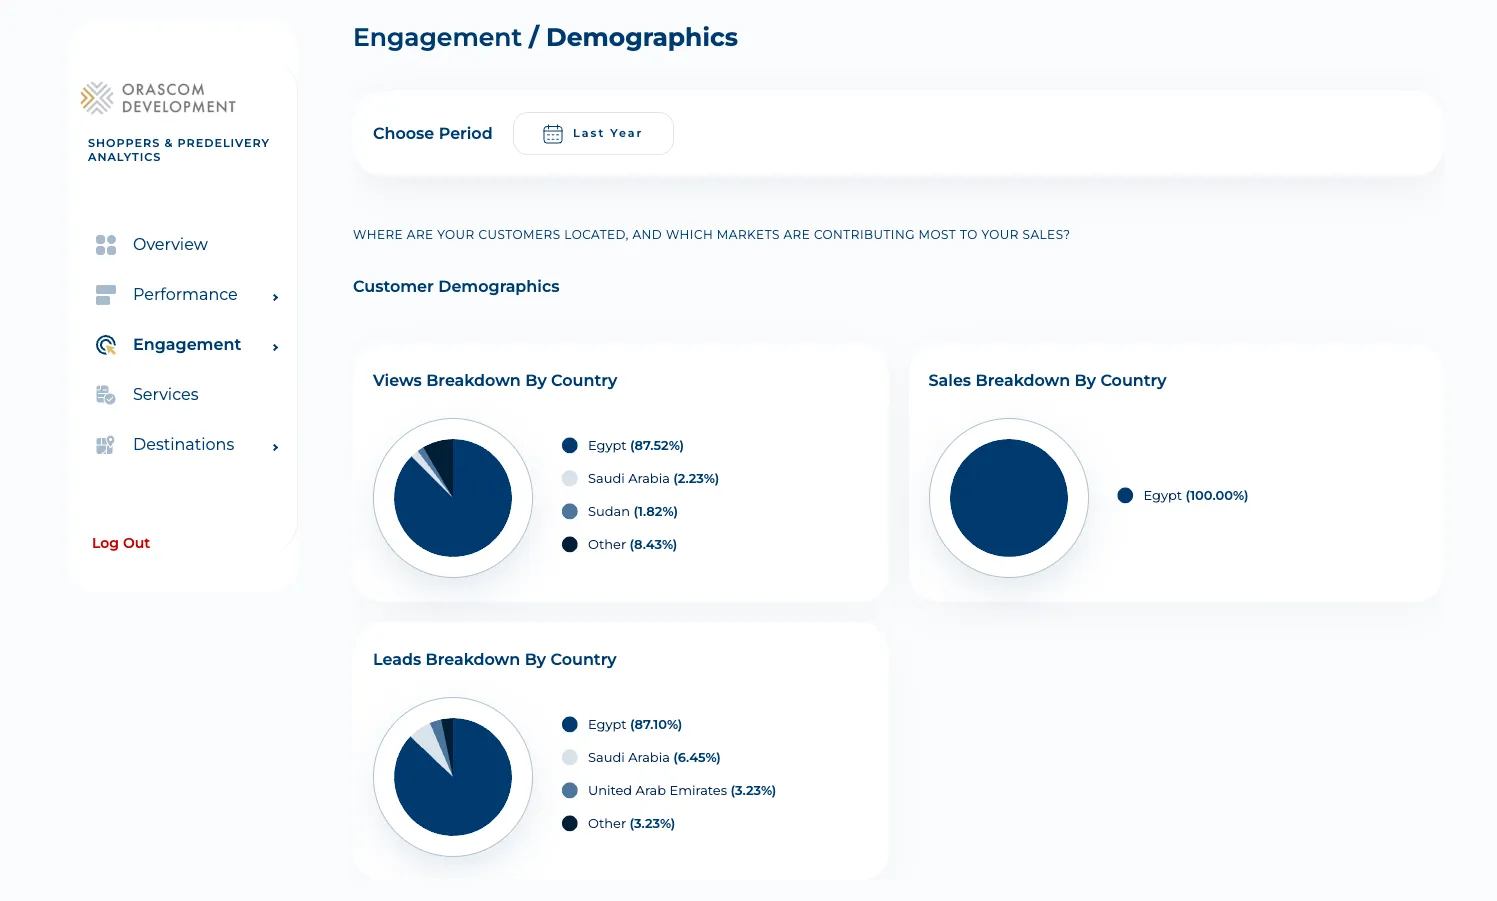
Calls: getAnalyticsPageViewsPerCountry
(/analytics/demographics/ggl-page-views-per-country), getAnalyticsSalesPerCountry
(/analytics/demographics/sales-per-country), getAnalyticsLeadsPerCountry
(/analytics/demographics/leads-per-country).
Services — /services
Section titled “Services — /services”Unit-services analytics: request counts per service type. pages/services/services.tsx.
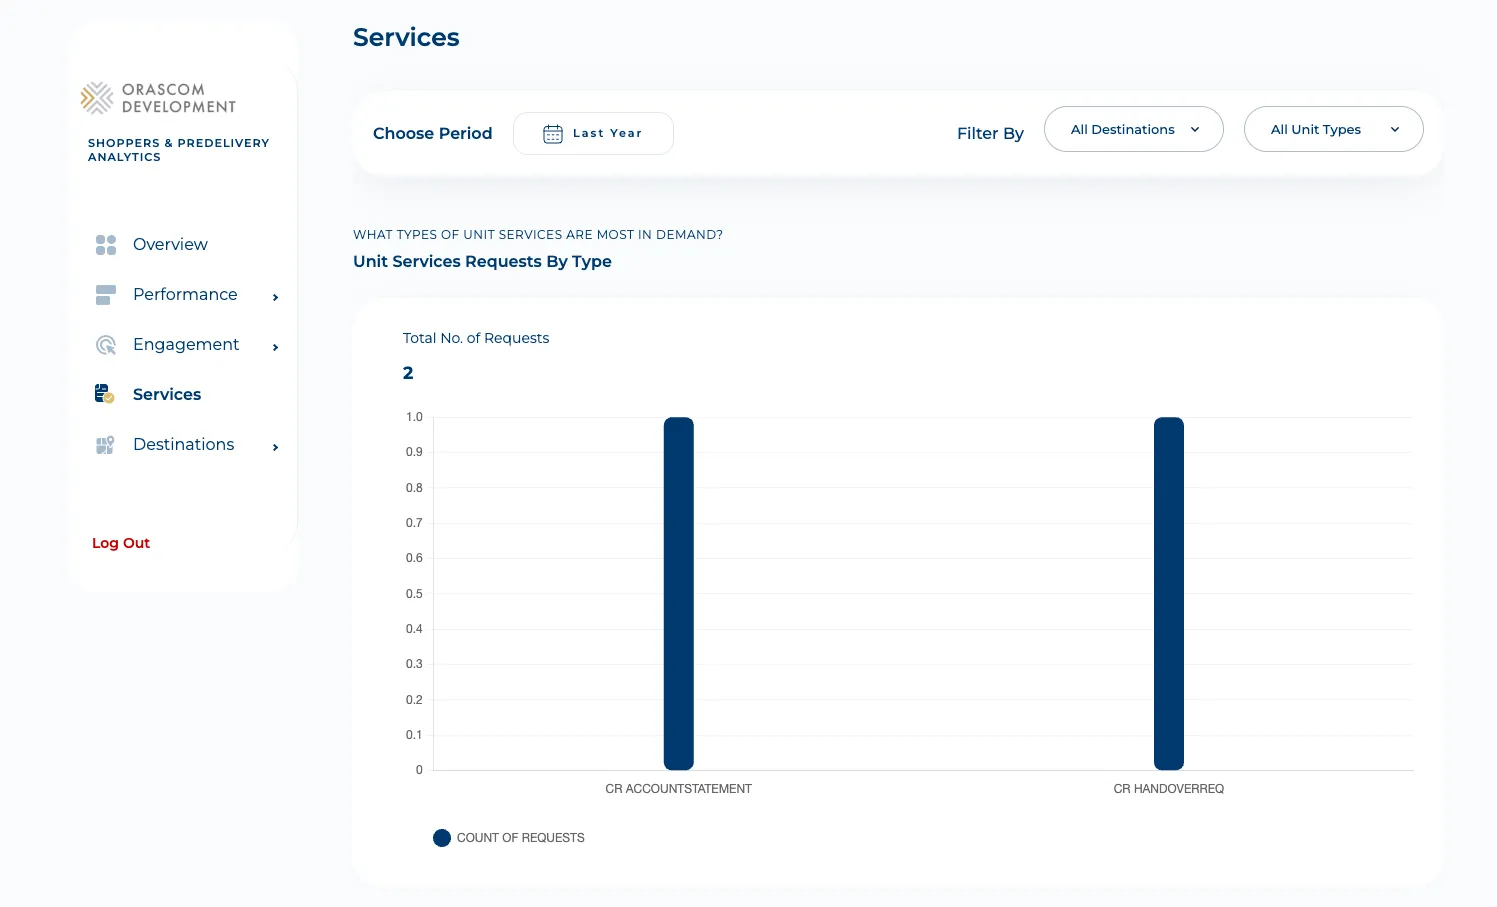
Calls: getUnitServicesRequestsByType (/analytics/unit-services/count-per-service-type),
getAnalyticsUserRequests (/analytics/user-requests/count).
Destination drill-down — /destination/:destinationSlug/:destinationId
Section titled “Destination drill-down — /destination/:destinationSlug/:destinationId”One drill-down per destination, reachable from the Destinations group: sales performance, payment
breakdowns, and revenue by unit type — scoped to that destination.
pages/destination/destination.tsx.
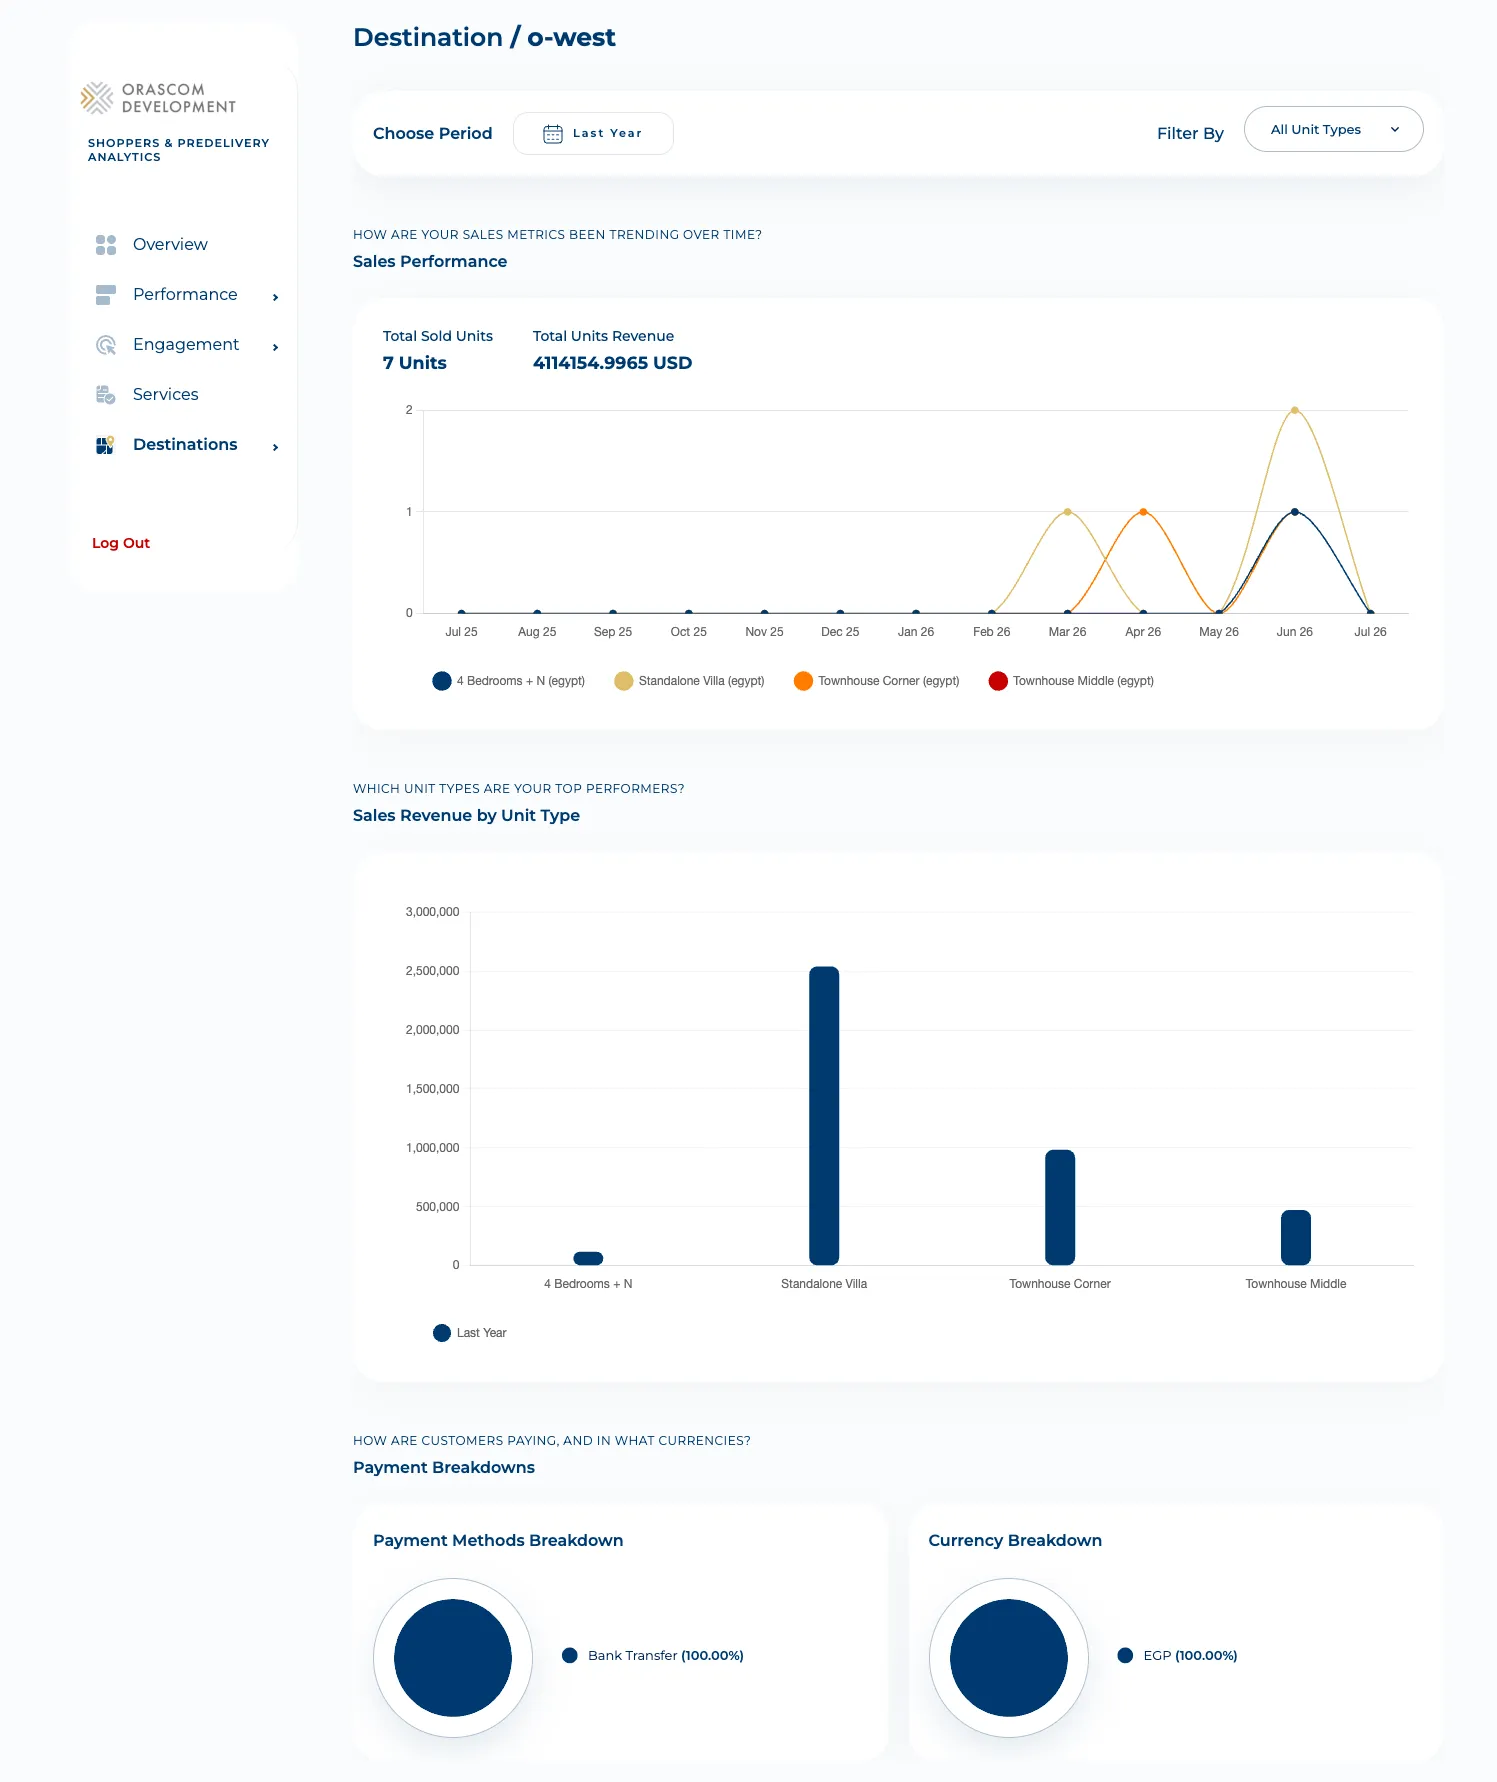
Calls (the Destination service): getAnalyticsDestinationSalesPerformance
(/analytics/sales/count-per-unit-types-breakdown) and the shared sales/payment breakdown endpoints,
scoped by destinationId.
Updates / Notifications — /notifications
Section titled “Updates / Notifications — /notifications”How it fetches data
Section titled “How it fetches data”There is no React Query in this app. Global filter state (period, destination, unit-type) lives
in a plain FILTER_CONTEXT; ProtectedRoutes primes the destination and unit-type filter options
on entry. Each chart component calls its data-service class directly on mount / filter-change, and the
service builds the URL from the current filter params via constructURL (@orascom/utils). Practical
consequences:
- There is no request cache or dedupe — changing a global filter re-fires the relevant charts’ requests. Adding a chart means adding an endpoint key + a service call, not a query hook.
- Shared filter UI comes from
@orascom/common-components(AnalyticsPeriodFilter,useAnalyticsFilters), so filter behavior is consistent with the other apps even without React Query.
Login is email + password (pages/login/login.tsx → Authentication.login →
POST {prefix}/login); on success storeTokenDetails persists the token
(authentication.ts:11-25). There is a full reset flow: /forget-password →
POST {prefix}/forgot-password, and /set-password → POST {prefix}/reset-password (used for both
the invite and the reset, and it also stores a token).
The bearer token is read from localStorage[NX_SHOPPER_ANALYTICS_ACCESS_TOKEN_KEY] and sent as
Authorization: Bearer <token> (network.ts:127-136). userDataLoader redirects to /login when
the token is absent or /me fails; ProtectedRoutes re-checks it on every navigation. logout =
POST {prefix}/logout + clear storage. There is no refresh token — an expired token simply
bounces the user to /login.